how do MEJ maps advance justice?
Mapping for Environmental Justice’s maps demonstrate the intersection of socioeconomic factors, environmental effects and pollution, and public health outcomes in an intuitive, accessible format.
By weaving together these data points, the map shows how pollution and environmental hazards disproportionately, consistently, and predominantly affect low-income communities and communities of color. This is an urgent problem: data show that these communities suffer myriad health issues, including increased mortality, at much higher rates because of environmental harm. We envision the map as a tool to advocate against these injustices and create policy change so that all people can enjoy healthy, safe places to live.
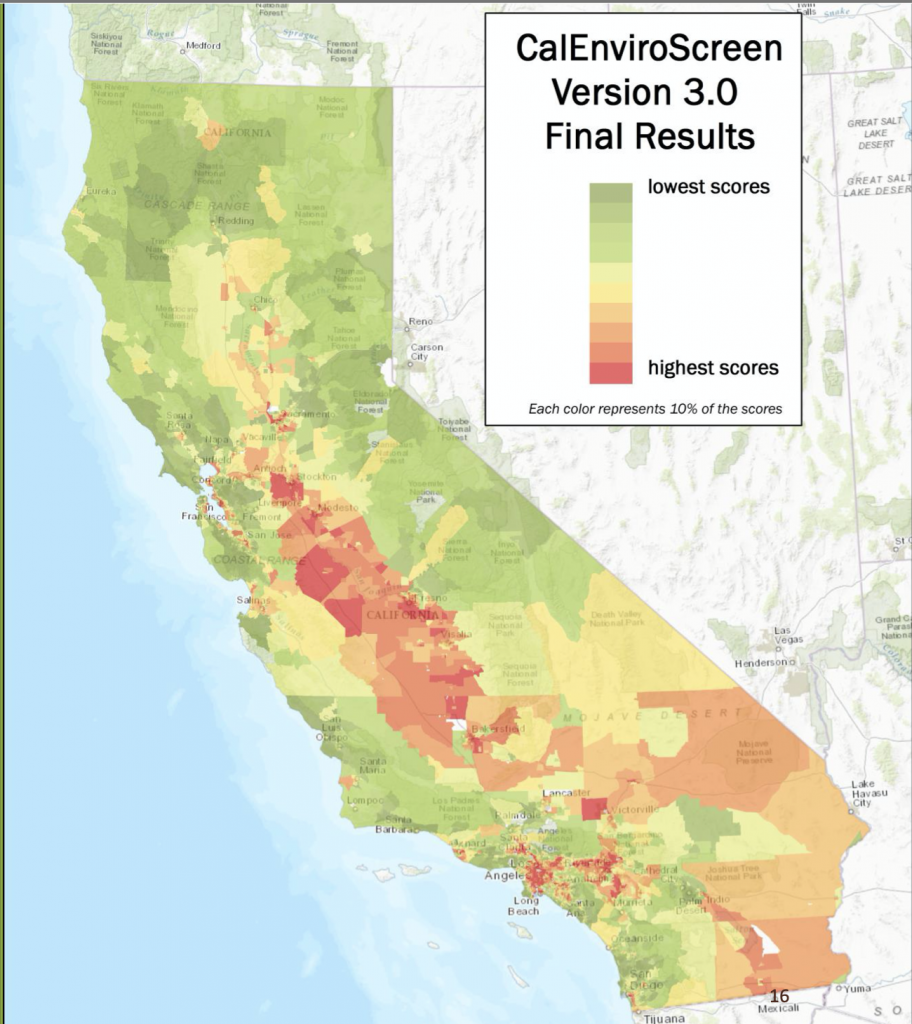
MEJ’s maps are based on the methodology and groundwork of CalEnviroScreen, which was created by California Environmental Justice Alliance (CEJA) and the California EPA. In California, state agencies use CalEnviroScreen to make direct key decisions throughout the state, including targeting investment of proceeds from California’s cap-and-trade program (AB 32). California-based advocates are able to use the map to apply for grants and demonstrate the needs in their communities. CEJA describes that CalEnviroScreen “provides a scientific assessment that corroborates the lived experiences of many Californians.” (CalEnviroScreen: A Critical Tool for Achieving Environmental Justice in California).
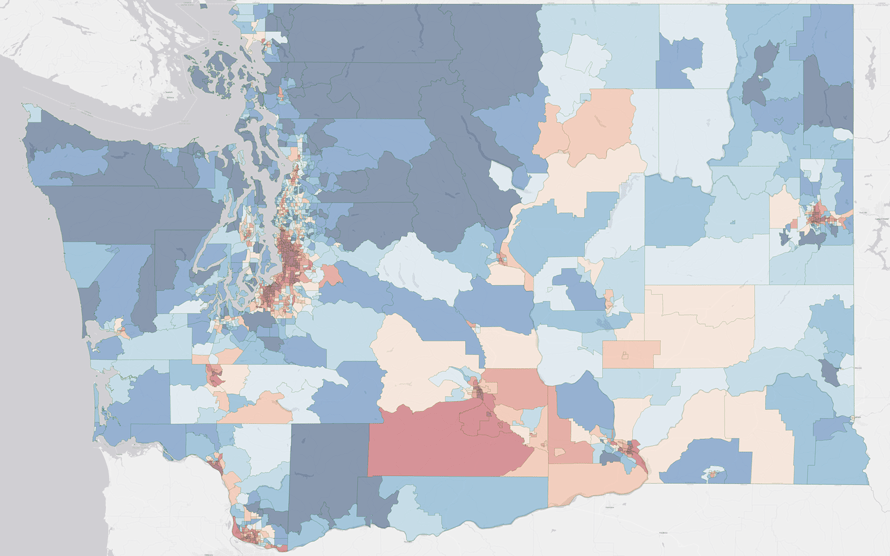
Our maps are based on the methodology and groundwork of California and Washington State:

California’s CalEnviroScreen

Washington Environmental Health Disparities Map
COVID-19 has Highlighted the Urgency of Mapping Cumulative Impacts
The importance of mapping environmental impacts, health, and socioeconomic information together has been highlighted by the current COVID-19 pandemic. Populations that have been historically marginalized are being hit the hardest by COVID-19 infections and deaths. Long-term exposure to environmental hazards is linked to the most severe outcomes. This pandemic highlights the urgency of addressing the disparities highlighted in maps like MEJ’s.
